 StockChat
Most fund managers don't beat the S&P 500
Over the past 15 years, about 90% of U.S. large-cap funds did worse than the S&P 500. This guide explains what an S&P 500 index fund actually holds, why it has been so hard for professionals to beat, and how far it has fallen in the past.

Most professional fund managers do not beat the S&P 500, and the gap gets wider the longer you measure it. In the 15 years that ended on June 30, 2026, about 90% of U.S. large-cap funds earned less than the index, according to S&P Dow Jones Indices. An S&P 500 index fund doesn't try to beat the market at all; it simply owns the roughly 500 companies in the index, which is a big part of why it is so hard to beat.
If you have ever asked someone how to get started with investing, there is a good chance they told you to "just buy the S&P 500." It sounds almost too simple, especially when you consider that there are thousands of professional fund managers whose entire job is to pick better stocks than everyone else. It turns out that the simple advice holds up remarkably well against the professionals, and the data behind that is worth understanding before you put money into either approach.
What is an S&P 500 index fund?
The S&P 500 is a list of about 500 of the largest publicly traded companies in the United States, maintained by S&P Dow Jones Indices since 1957. An index fund that tracks it buys every company on that list, in the same proportions as the index, so that when you buy one share of the fund you end up owning a very small piece of all of them at once. The first index fund available to regular investors was launched by Vanguard in 1976, and at the time plenty of people in the industry doubted that investors would ever be happy settling for the market's average.
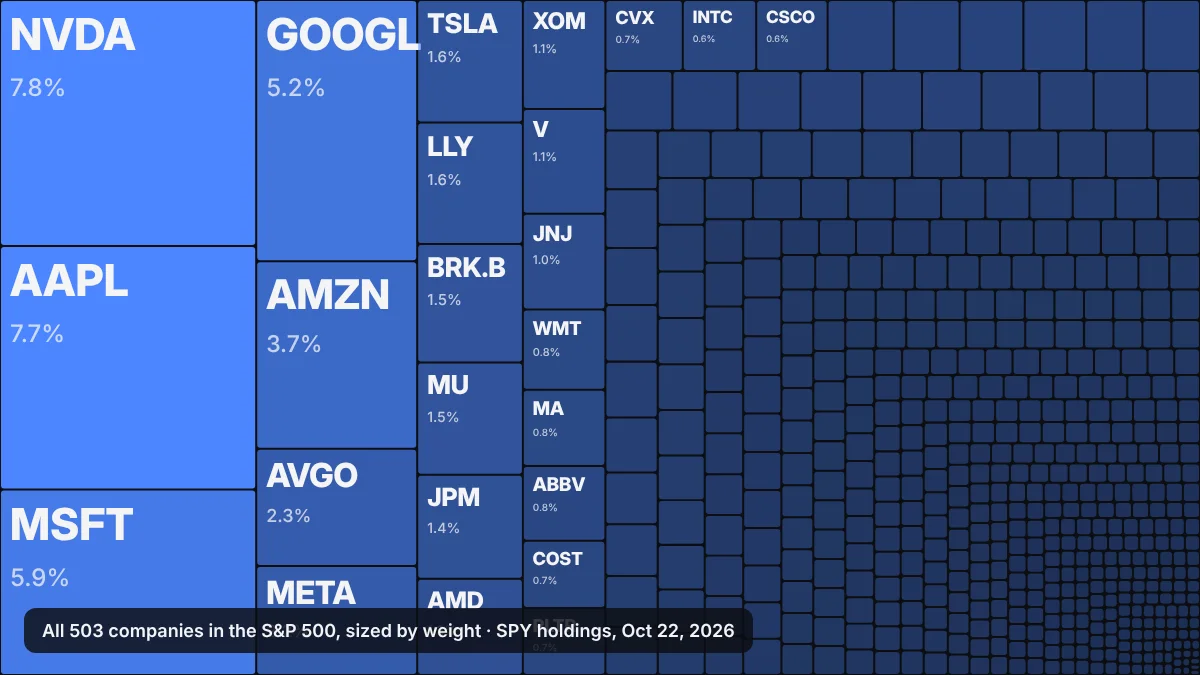
The fund doesn't hold every company equally. Each company's weight depends on its size, measured by the total value of its shares, which means a handful of very large companies make up a surprisingly large share of the whole. As of October 22, 2026, the ten largest holdings in the SPDR S&P 500 ETF (SPY) accounted for about 39% of the fund, and the five largest are shown in the table below.
| Company | Ticker | Share of fund |
|---|---|---|
| Nvidia | NVDA | 7.8% |
| Apple | AAPL | 7.7% |
| Microsoft | MSFT | 5.9% |
| Alphabet | GOOGL | 5.2% |
| Amazon | AMZN | 3.7% |
The figures come from State Street's SPY holdings file dated October 22, 2026, with Alphabet's two share classes combined.
That concentration is worth keeping in mind. When people say an index fund is "diversified," they are right that it owns hundreds of companies, but in practice the biggest technology companies have a large influence on how the fund performs in any given year.
Do fund managers beat the S&P 500?
Most of them don't, and the evidence for that has been unusually consistent. Twice a year, S&P Dow Jones Indices publishes a report called SPIVA that compares actively managed funds with the index they are trying to beat, and the results have been consistent for more than two decades. The chart below shows the share of U.S. large-cap funds that did worse than the S&P 500 over each period ending June 30, 2026.
The source is the SPIVA U.S. Mid-Year 2026 scorecard, Report 1a.
The one-year number tends to bounce around, because any manager can have a good year, but the longer periods tell a clearer story. Over 20 years, almost 93% of these funds trailed the index, which means that if you had picked a large-cap fund at random two decades ago, the odds that it beat a plain S&P 500 fund would have been roughly one in fourteen.
There are a few reasons this happens, and none of them require the managers to be bad at their jobs. Active funds charge higher fees than index funds, and those fees come out of returns every single year. They also trade more often, which adds costs, and they are competing against other professionals who have access to the same information, so being right more often than the rest of the market is genuinely hard to do for a long stretch of time.
How has the S&P 500 done over time?
Over long periods the index has gone up, but the path has been anything but smooth. From the end of 2000 to the end of 2025, the S&P 500's price rose from about 1,320 to about 6,846, which works out to roughly 6.8% a year before counting dividends. In that same stretch, 18 of the 25 calendar years ended higher than they started, while the other seven ended lower, including a 38% drop in 2008 alone.
Can an S&P 500 index fund lose money?
Yes, and sometimes it loses a lot. Owning 500 companies protects you from the risk that any single company collapses, but it does nothing to protect you from the whole market falling at once, which is exactly what happens during a recession or a financial crisis.
| Decline | Peak to bottom | Back to the old high |
|---|---|---|
| Dot-com bust (2000 to 2002) | −49% | May 2007 |
| Financial crisis (2007 to 2009) | −57% | March 2013 |
| COVID crash (2020) | −34% | August 2020 |
| Rate hikes (2022) | −25% | January 2024 |
These figures use S&P 500 daily closing prices from Yahoo Finance and measure price changes only.
The recovery times are the part people tend to underestimate. Someone who bought at the peak in October 2007 had to wait until March 2013, more than five years, just to get back to where they started, and that is a long time to stay patient while the news is telling you that things are getting worse. On the other hand, the COVID crash in 2020 was the fastest decline on the list and also one of the fastest recoveries, which shows how hard it is to predict how long any particular downturn will last.
How do you check a single stock against the S&P 500?
None of this means you shouldn't own individual stocks, and plenty of people enjoy researching companies and talking them over with friends. It does mean that the S&P 500 is the fair yardstick for any stock you are considering, because if a company can't keep up with the index over time, owning the index would have given you a similar result with less work and less risk.
To show what that comparison looks like in practice, here is what StockChat's Analysis feature said about the two largest companies in the index, Nvidia and Apple, using closing prices from October 23, 2026. Both answers compare the stock's total return over the past year, including dividends, with the S&P 500's total return over the same twelve months, which is why the index figure here is a little higher than the price-only numbers earlier in this article.
Over the past twelve months, Apple returned 34.5% against 14.3% for the S&P 500, which put it ahead by 20.1 percentage points, and it was also ahead over the most recent three months.
Over the same twelve months, Nvidia returned 16.1% against the index's 14.3%, which is close enough that the app calls it roughly even, and over the last three months it actually trailed the index, returning 1.2% against 3.2%.
These answers come from StockChat's Analysis feature, calculated from closing prices on October 23, 2026, with dividends included in both returns.
The Nvidia result is a good example of why the comparison matters. Nvidia is the single largest holding in the S&P 500, and the app's own record describes it as one of the best-performing stocks of the past 27 years, yet over the most recent year someone who simply owned the whole index ended up in roughly the same place as someone who owned only Nvidia, without taking on the much larger swings that come with a single stock. The app's own history for Nvidia shows that the stock has fallen more than half from a high on seven separate occasions since 1999, including a 90% drop in 2002, which is a far deeper fall than the index's worst decline of 57% during the financial crisis.
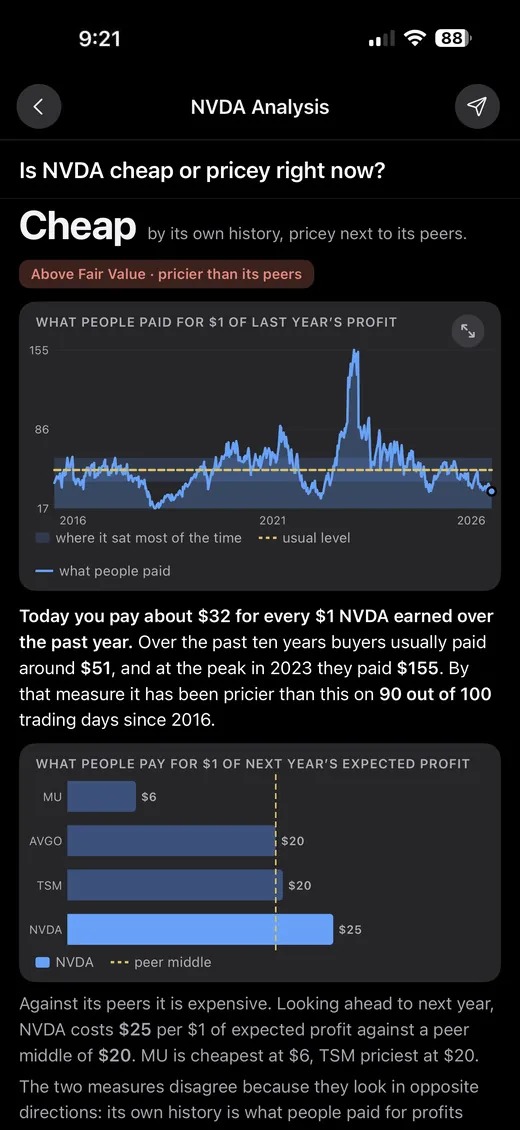
StockChat is a private group chat with the research built in. Every stock in the app comes with plain-English answers to eighteen questions like the two above, including how bad its drops have been and how long it usually takes to recover, so your whole group can look at the same numbers before anyone makes a decision.
Join the free betaFrequently asked questions
What is an S&P 500 index fund?
A fund that holds the roughly 500 companies in the S&P 500, in proportion to their size, so one share gives you a small slice of all of them.
Do most fund managers beat the S&P 500?
No. Over the 15 years to June 30, 2026, 90.49% of U.S. large-cap funds did worse than the S&P 500, according to S&P Dow Jones Indices' SPIVA scorecard.
Can an S&P 500 index fund lose money?
Yes. The S&P 500 fell about 57% from October 2007 to March 2009 and about 25% during 2022. Spreading money across 500 companies lowers single-company risk but not market risk.
Oscar is the founder of StockChat, where he writes plain-English guides that explain how the market works and where the numbers behind it come from. LinkedIn
This article is educational and is not financial advice.
 Is Day Trading Worth It? What the Research Shows
 What is dividend yield, and when is a high one a warning?
 What Is an Investment Club and How Does One Work?